https://leanmanufacturingtools.org/551/creating-a-value-stream-map/
Creating A Value Stream Map
This is a step by step guide to creating a current state value stream map, the first step in working towards your ideal state value stream and a truly lean system. Your current state value stream map is a team effort that is conducted by those people who are involved in the process, at the actual process, not by an expert locked in a room with a pile of procedures.
Below we will go through;
- Selecting the product (family) to map
- VSM Symbols
- Defining the process boundaries
- The Process Steps
- Information Flows
- Process Data
- Calculating the Time Line
- Multiple Suppliers and Customers
- Interpreting the Data
- Next Steps (Ideal and future state maps)
You can also download a free Value Stream Mapping presentation in PPT and PDF format that goes with this page:
How to Value Stream Map Presentation PPT Download
How to VSM presentation PDF Download
What is Value Stream Mapping (VSM)
Your Value stream map is a representation of the flow of materials from supplier to customer through your organization as well as the flow of information. This enables you to see at a glance where the delays are in your process, any restraints and excessive inventory. Your current state map is the first step in working towards your ideal state for your organization.
How to create a VSM
Value stream mapping (VSM) is a team exercise and should involve representatives from all of the areas within the process being mapped, this process should be facilitated and led by an expert with experience in creating value stream maps. A value stream map is best created by hand using a pencil (you will need to make frequent corrections and changes) on a sheet of A3 paper. It is better to create by hand and involve the entire team in its creation rather than have an expert take the information and return later with a finished map!
Step by step guide to Value Stream Mapping;
Select the product or product family
Firstly we need to decide what it is exactly that we wish to map, in a company with many products there may have to be some initial work done to identify which product or family group of products that should be mapped, we may decide to go with highest volume or value, or take a longer term strategic look at those product ranges that we expect to do more business with in the future or we may be guided by our customers as to what to map.
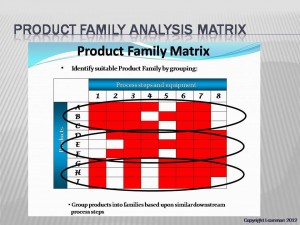
If we have a plethora of products we may wish to first conduct a product family analysis, this is a simple review of our products and which processes they go through. It may not be necessary to analyze all products, use a Pareto analysis to decide which products you need to analyze (either through volume or value or a combination.) This analysis can help us group together products that share common routing through our processes. Our value stream map can then concentrate on either a single product or a family of them sharing common processes.
Value Stream Mapping Symbols
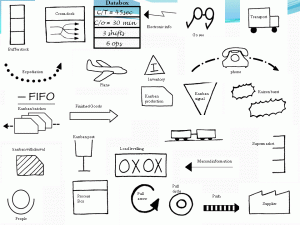
The picture to the Left shows some of the commonly used value stream mapping symbols and their meanings. It is not necessary to use these specific symbols, if you have symbols that are more relevant / descriptive for your processes then use those.
Bound the Process
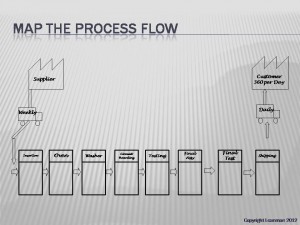
We need to decide the limits of our map, most value stream maps are conducted from supplier through to customer within an organization and these should be the first boxes placed on your VSM to bound the process. It is possible to map the entire supply chain, in this case the start and end points for your process map would be the raw materials and the final consumer, instead of putting boxes for process steps thereafter however you would use companies.
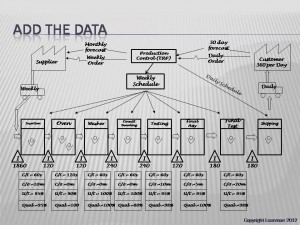
Process steps
Once you have your process boundaries established you need to define your process steps for your map, some people advocate walking the process from customer back to supplier or the other way around, quite frankly it does not matter too much which way you do it.
The process steps are the various operations that are performed on the product, these are generally located in a single place with one point that inventory enters and then leaves. We are not breaking down each operation into specific tasks, there are other process mapping techniques such as flow charting that would be a better tool for analyzing to that level of detail.
Add Information Flows to your Value Stream Map
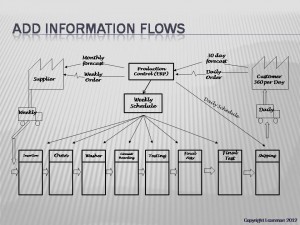
One of the things that differentiates a VSM from most other mapping tools is the inclusion of the information flows into the map. We need to include how the customers order product, frequency and method, and how we translate that back to our supplier. We also include how we then communicate requirements to our processes to ensure that we produce what the customer wants.
Collect Process Data
This where we need to do a little thinking and some work, get the team to collect data regarding the performance of each step of the process; typical types of date to collect are;
- Inventory
- Cycle time (time taken to make one product)
- Change over time (from last good piece to next)
- Up-time (on-demand machine utilization)
- Number of operators
- Shifts worked
- Net available working time
- Scrap rate
- Pack size/pallet sizes
- Batch Size
Select the relevant measures for your process and record actual data at the workplace, try to avoid “historical” measures where possible, get your own current information. If you do use timings and other data from the “system” to save time make a note of those measures and ensure that you go back and verify them during the action phase. Record this data in the “data boxes” on your Value Stream Map
Inventory
Inventory and overproduction are two of the biggest of the seven wastes of lean and tend to occur when we have problems in our production processes. We use excess inventory to cushion ourselves against process problems so careful note should be taken of inventory build up. When counting inventory for your map question carefully as it is not unusual to find pallets of inventory stored in odd locations due to previous problems or as a contingency.
Time Line
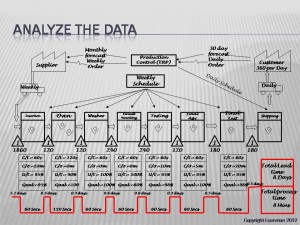
We create the time line to give us information about total process times and lead times for inventory through our processes; we use the inventory at each stage and the daily demand to calculate the amount of stock in days and add this to the top of the time line, this will allow us to calculate a total lead time. The cycle time for one product is then placed in the lower portion and this will be added to give a total processing time.
It is usual to at this point to have lead times that are several days to several weeks and processing times that are are only a few minutes which highlights just how much waste there is in our system.
This gives us our completed current state value stream map; now the real work can start.
Multiple Suppliers and Customers in VSM
The map produced above is a fairly simple map with just one customer and one supplier, more often than not we have multiple suppliers and customers and it may be necessary to draw on more than one. In this case the process is still the same but when you calculate your timeline use the worst case for inventory. If you have many suppliers it may be worth concentrating on your most important suppliers or grouping them into similar types such as fasteners.
More often than not you can still show multiple customers as one, or if required as groups with similar requirements such as weekly or monthly demands.
Interpreting the Value Stream Map
The data boxes and the timeline contain much information about our process, you can now see in one document where the problem areas within your process lie, issues such as;
- Excessive Inventory
- Long cycle times
- Low uptime
- Excessive Setup Times
- Poor Quality / Rework
Creating an Ideal and Future State Value Stream Map
These problems highlighted above could all be tackled one by one; but what we really need is a vision of where we want to end up so that we can focus our efforts on achieving an agreed “Ideal State.” The team guided by the expert should create an ideal state value stream map which should envision the absolute best the process could be, this should then be agreed by senior management as the ultimate goal of your value stream mapping exercise. This Ideal state could be a single cell rather than isolated process silos in different parts of the factory with daily (or more frequent) deliveries to the customer and from the supplier. Kanban systems could be utilized to remove the need for planning and scheduling as well as many other ideas that could be considered.
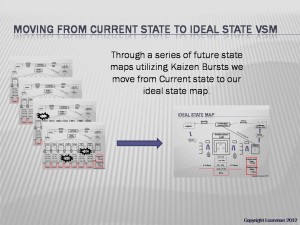
Once you have your ideal state then you can plan to achieve your shared vision of where the process needs to be; the simplest way to do this is to plan a series of improvements, each taking two to three months, and use your value stream map to communicate what you want to do. Use the kaizen burst symbol on your current state map to highlight the improvements that you want to make, for instance reducing the setup time on the final test from 20 minutes to 5 minutes, your aspirations for your improvements become your future state value stream map. You may need several iterations of future state maps before you finally reach your ideal state.
If you have any questions about conducting value stream mapping (VSM) or creating a value stream map please leave them in the section below.

Комментариев нет:
Отправить комментарий